Simple
generation of locally constrained values in numpyro
Just a simple experiment using numpyro to simulate
values from a function with locally constrained values. This is often
achieved using Gaussian processed but I thought it would be interesting
to try something a bit more intuitive, plus priors on the points
themselves and their interdependence can be anything, not just normal
distributions.
import jax
import jax.numpy as jnp
import matplotlib.pyplot as plt
import numpy as np
import numpyro.distributions as dist
import seaborn as sns
from numpyro import sample
from numpyro.infer import MCMC, NUTS

sns.set_theme('notebook', 'ticks', font='Arial')

plt.rcParams['figure.dpi'] = 200
First, baseline: Independent draws from a normal distribution.
def model1():
    x = sample("x", dist.Normal().expand([100]))


mcmc = MCMC(NUTS(model1), num_warmup=1000, num_samples=100)
mcmc.run(jax.random.PRNGKey(0))
samples = mcmc.get_samples()

x_points = np.repeat(np.arange(100)[None, :], samples["x"].shape[0], axis=0)
plt.scatter(
    x_points.flatten(), samples["x"].flatten(), color="darkblue", alpha=0.01, s=10
)
plt.gca().set(xlabel="Spatial/temporal dimension", ylabel="Observable");
sample: 100%|██████████| 1100/1100 [00:00<00:00, 1656.79it/s, 7 steps of size 4.46e-01. acc. prob=0.86]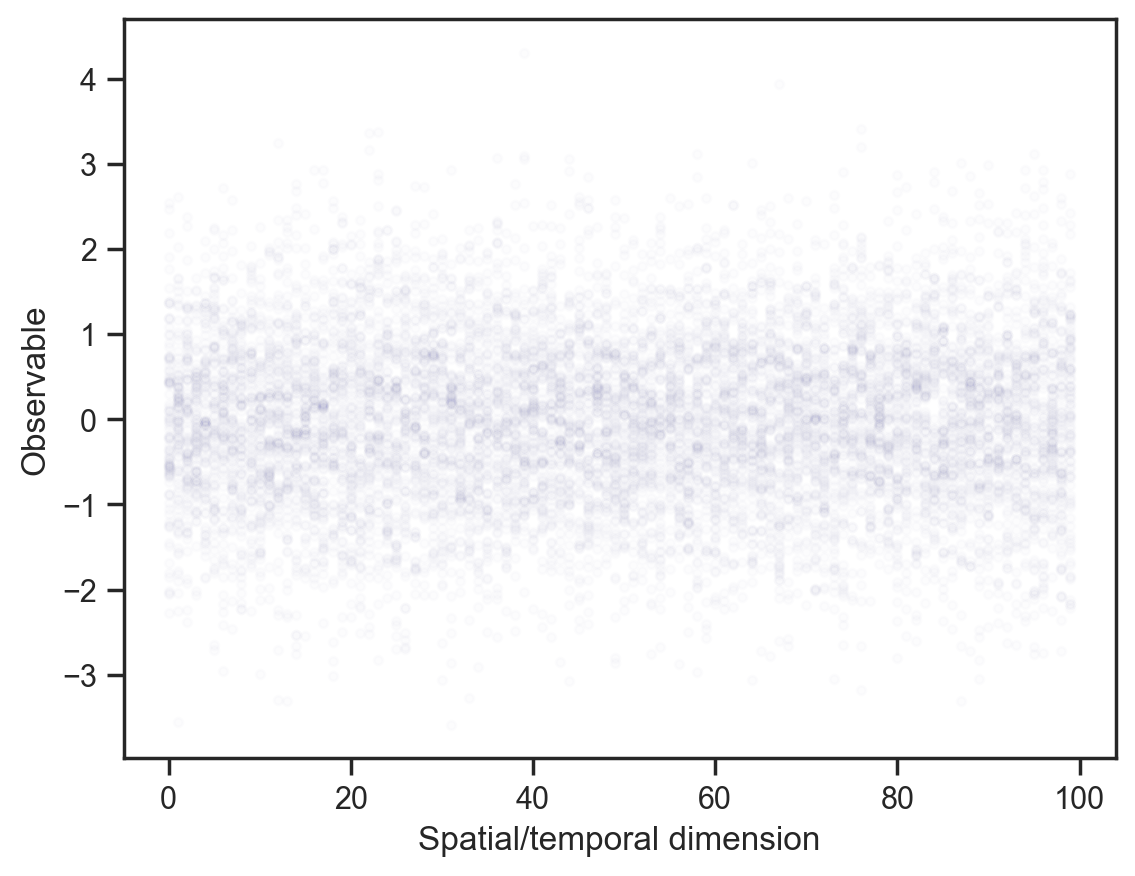
Adding some point observations …
obs_vals = jnp.array([3.3, -2.5, 4.9])
obs_idx = jnp.array([20, 40, 75])

def model2(obs_vals, obs_idx):
    x = sample('x', dist.Normal().expand([100]))
    sample('x_point_obs', dist.Normal(loc=obs_vals, scale=0.1), obs=x[obs_idx])


mcmc = MCMC(NUTS(model2), num_warmup=1000, num_samples=100)
mcmc.run(jax.random.PRNGKey(0), obs_vals, obs_idx)
samples = mcmc.get_samples()

plt.scatter(x_points.flatten(), samples['x'].flatten(), color='darkblue', alpha=0.01, s=10);
plt.scatter(obs_idx, obs_vals, label='Observed values', color='crimson', s=20)
plt.legend();
sample: 100%|██████████| 1100/1100 [00:00<00:00, 1624.28it/s, 15 steps of size 4.02e-01. acc. prob=0.90]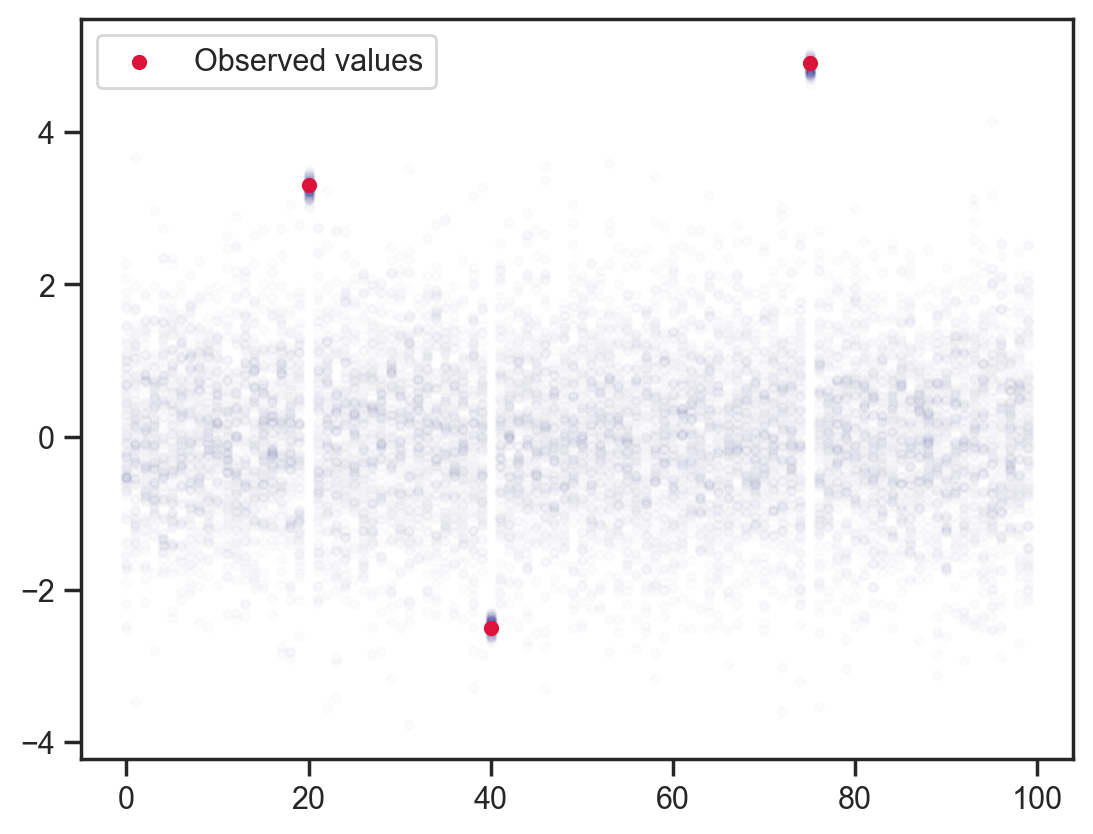
“Observing” each point to be the average of previous and following points. This would be equivalent to adjusting the log-likelihood or adding a potential in other packages.
def model3(obs_vals, obs_idx):
    x = sample('x', dist.Normal().expand([100]))
    sample('x_dependence', dist.Normal(loc=(x[:-2]+x[2:])/2.0, scale=0.1), obs=x[1:-1])
    sample('x_point_obs', dist.Normal(loc=obs_vals, scale=0.1), obs=x[obs_idx])


mcmc = MCMC(NUTS(model3), num_warmup=1000, num_samples=100)
mcmc.run(jax.random.PRNGKey(0), obs_vals, obs_idx)
samples = mcmc.get_samples()

plt.scatter(x_points.flatten(), samples['x'].flatten(), color='darkblue', alpha=0.01, s=10)
plt.scatter(obs_idx, obs_vals, label='Observed values', color='crimson', s=20)
plt.legend();
sample: 100%|██████████| 1100/1100 [00:01<00:00, 903.87it/s, 63 steps of size 8.62e-02. acc. prob=0.84] 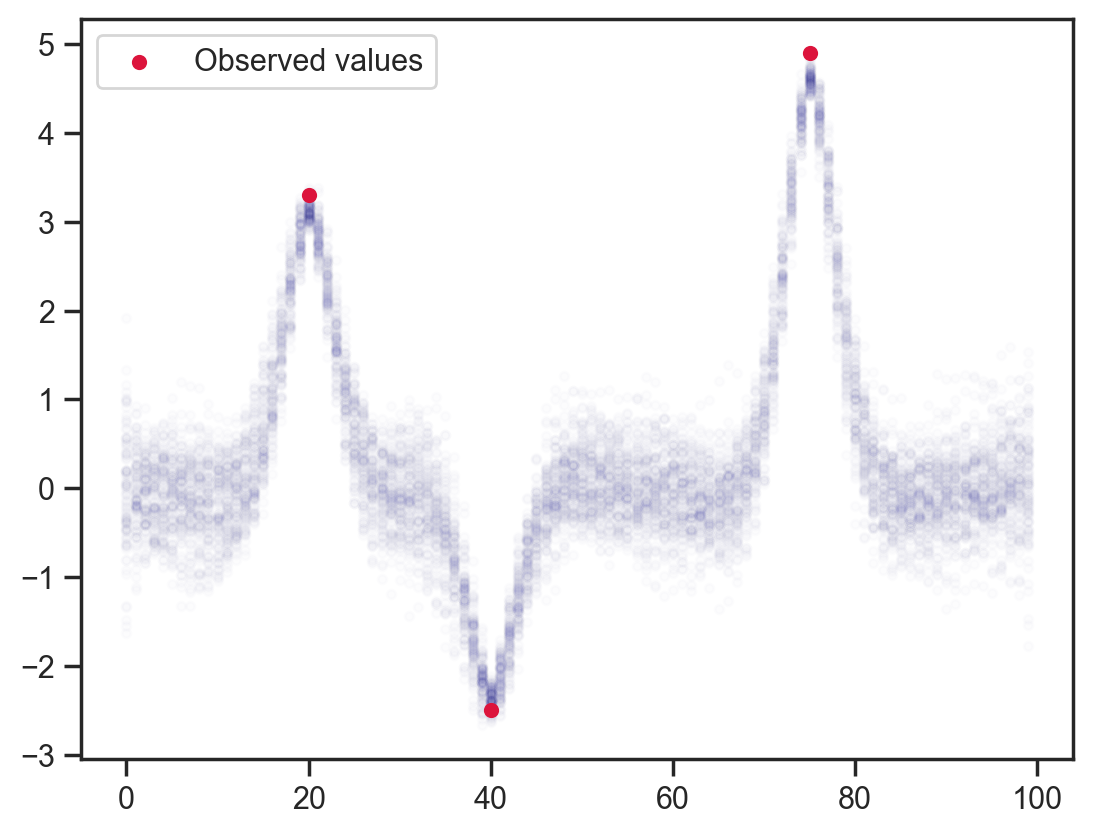
Slightly fancier — weighted relation to next/previous 2 points. I don’t notice a dramatic change with this 1:2:2:1 weighting but it would be interesting to add asymmetric constraints, etc. I suppose this could be useful for probabilistic low-pass filtering with sinc weights.
def model4(obs_vals, obs_idx):
    x = sample('x', dist.Normal().expand([100]))
    sample('x_pre_obs', dist.Normal(loc=(x[:-4]+2.0*x[1:-3]+2.0*x[3:-1]+x[4:])/6.0, scale=0.1), obs=x[2:-2])
    sample('x_point_obs', dist.Normal(loc=obs_vals, scale=0.1), obs=x[obs_idx])


mcmc = MCMC(NUTS(model4), num_warmup=1000, num_samples=100)
mcmc.run(jax.random.PRNGKey(0), obs_vals, obs_idx)
samples = mcmc.get_samples()

plt.plot(samples['x'].T, color='darkblue', alpha=0.01)
plt.scatter(obs_idx, obs_vals, label='Observed values', color='crimson', s=20)
plt.legend();
sample: 100%|██████████| 1100/1100 [00:01<00:00, 1011.04it/s, 63 steps of size 9.88e-02. acc. prob=0.89]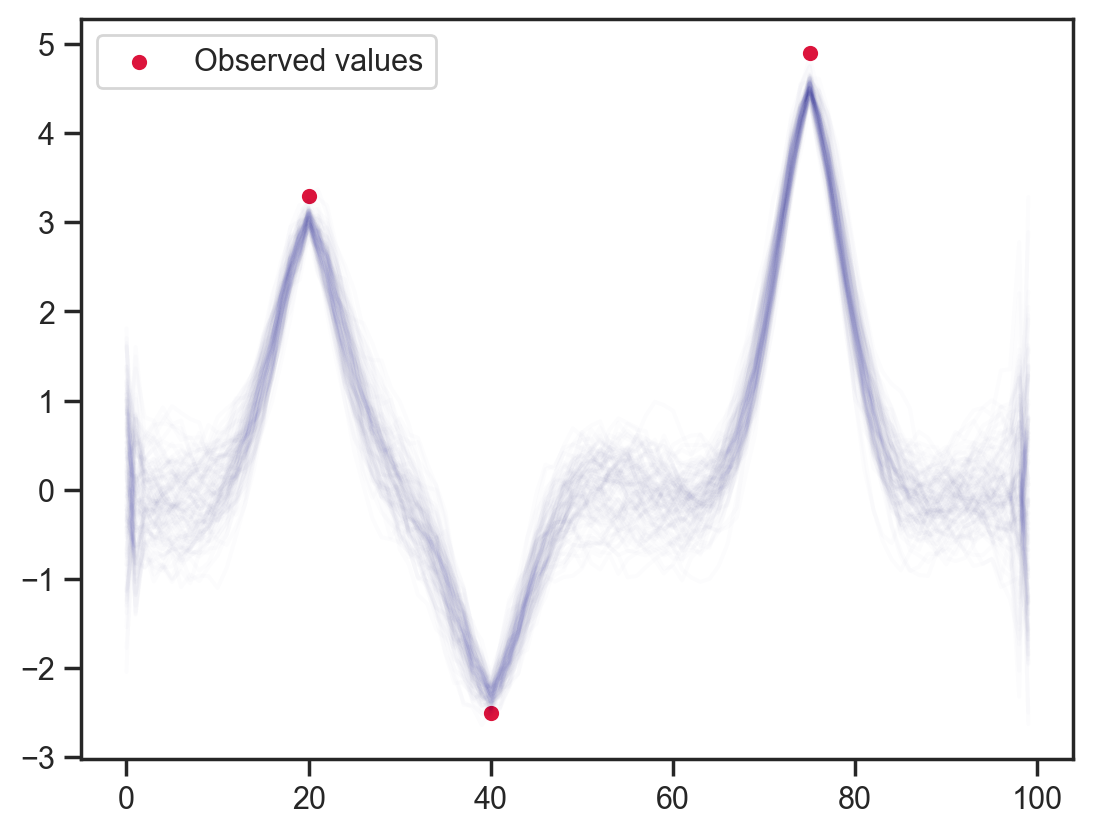
Something a bit more interesting. Let’s change the “base” distribution to be bimodal and asymmetric. I have picked fairly broad humps so we have a fair shot at achieving good mixing.
mixing_distribution = dist.Categorical(jnp.array([0.3, 0.7]))
component_distribution = dist.Normal(
    loc=jnp.array([-3.0, 3.5]), scale=jnp.array([1.0, 1.5])
)

d = dist.MixtureSameFamily(mixing_distribution, component_distribution)

x = jnp.linspace(-10, 10, 200)
y = np.exp(d.log_prob(x))

plt.fill_between(x, y, alpha=0.3, color='darkblue')
plt.gca().set(xlabel='x', ylabel='PDF');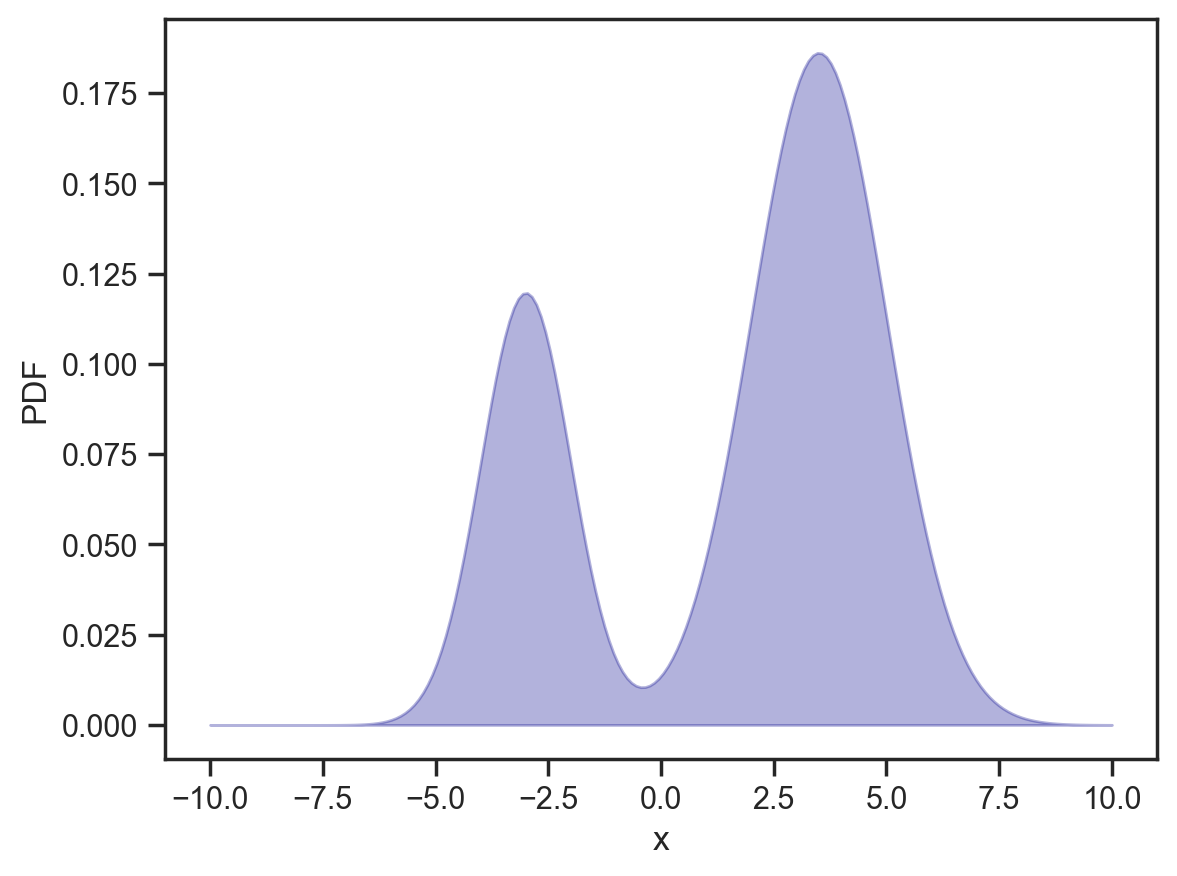
def model5(obs_vals, obs_idx):
    x = sample('x', d.expand([100]))

mcmc = MCMC(NUTS(model5), num_warmup=1000, num_samples=200)
mcmc.run(jax.random.PRNGKey(0), obs_vals, obs_idx)
samples = mcmc.get_samples()

x_points = np.repeat(np.arange(100)[None, :], samples['x'].shape[0], axis=0)
plt.scatter(x_points.flatten(), samples['x'].flatten(), color='darkblue', alpha=0.01, s=10);
sample: 100%|██████████| 1200/1200 [00:00<00:00, 1610.28it/s, 15 steps of size 1.68e-01. acc. prob=0.83]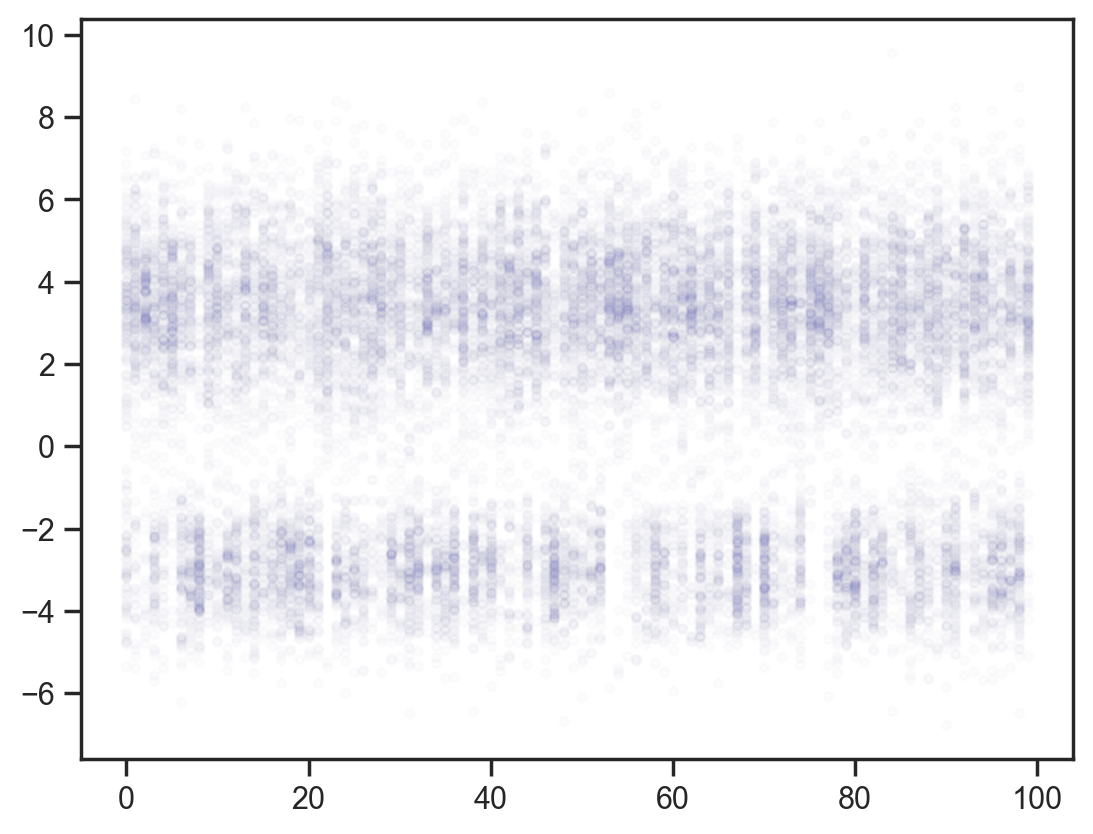
Adding back the observation constraints without dependence.
def model6(obs_vals, obs_idx):
    x = sample('x', d.expand([100]))
    sample('x_point_obs', dist.Normal(loc=obs_vals, scale=0.1), obs=x[obs_idx])

mcmc = MCMC(NUTS(model6), num_warmup=1000, num_samples=200)
mcmc.run(jax.random.PRNGKey(0), obs_vals, obs_idx)
samples = mcmc.get_samples()

x_points = np.repeat(np.arange(100)[None, :], samples['x'].shape[0], axis=0)
plt.scatter(x_points.flatten(), samples['x'].flatten(), color='darkblue', alpha=0.01, s=10)
plt.scatter(obs_idx, obs_vals, label='Observed values', color='crimson', s=20)
plt.legend();
sample: 100%|██████████| 1200/1200 [00:00<00:00, 1463.46it/s, 15 steps of size 1.48e-01. acc. prob=0.87]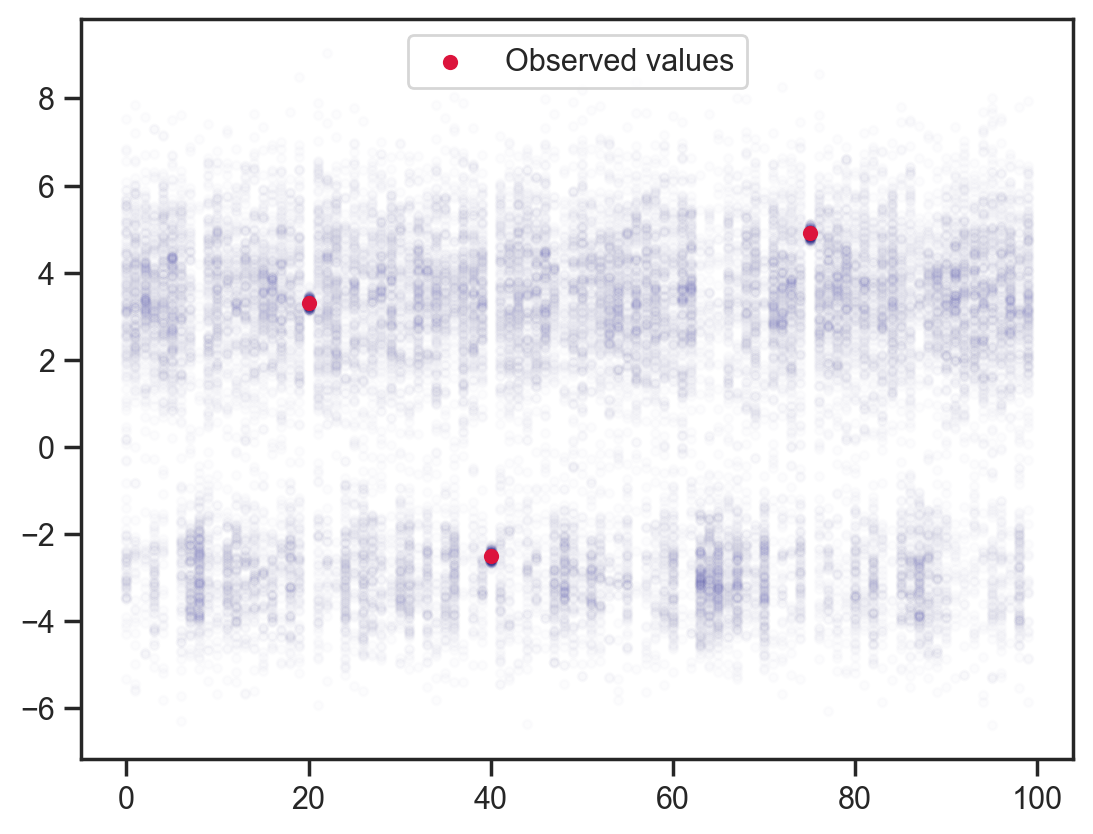
Finally, bringing back dependency on adjacent points …
def model6(obs_vals, obs_idx):
    x = sample('x', d.expand([100]))
    sample('x_dependence', dist.Normal(loc=(x[:-2]+x[2:])/2.0, scale=0.1), obs=x[1:-1])
    sample('x_point_obs', dist.Normal(loc=obs_vals, scale=0.1), obs=x[obs_idx])

mcmc = MCMC(NUTS(model6), num_warmup=1000, num_samples=200)
mcmc.run(jax.random.PRNGKey(0), obs_vals, obs_idx)
samples = mcmc.get_samples()

x_points = np.repeat(np.arange(100)[None, :], samples['x'].shape[0], axis=0)
# plt.scatter(x_points.flatten(), samples['x'].flatten(), color='darkblue', alpha=0.01, s=10)
plt.scatter(obs_idx, obs_vals, label='Observed values', color='crimson', s=20, zorder=10)
plt.plot(samples['x'].T, color='darkblue', alpha=0.01)
plt.legend();
sample: 100%|██████████| 1200/1200 [00:03<00:00, 356.29it/s, 255 steps of size 2.30e-02. acc. prob=0.88]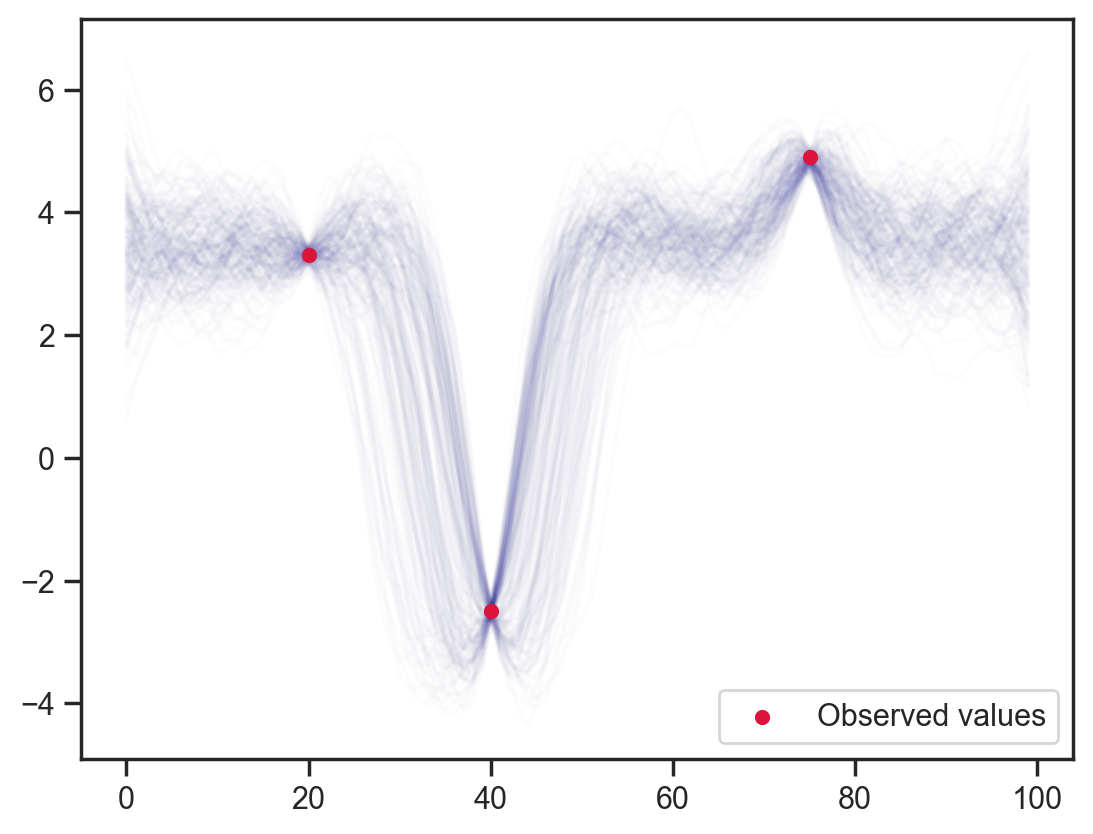
And now just for fun, let’s try a bimodal dependency distribution, here essentially saying that each point is likely to be larger than its neighbor (or linger in the same ballpark).
d_dep = dist.MixtureSameFamily(
    mixing_distribution,
    dist.Normal(loc=jnp.array([0, 0.5]), scale=0.1)
)

x = jnp.linspace(-1, 1, 200)
y = np.exp(d_dep.log_prob(x))

plt.fill_between(x, y, alpha=0.3, color='darkblue')
plt.gca().set(xlabel='x', ylabel='PDF', title='$x_i - x_{i-1}$ prior');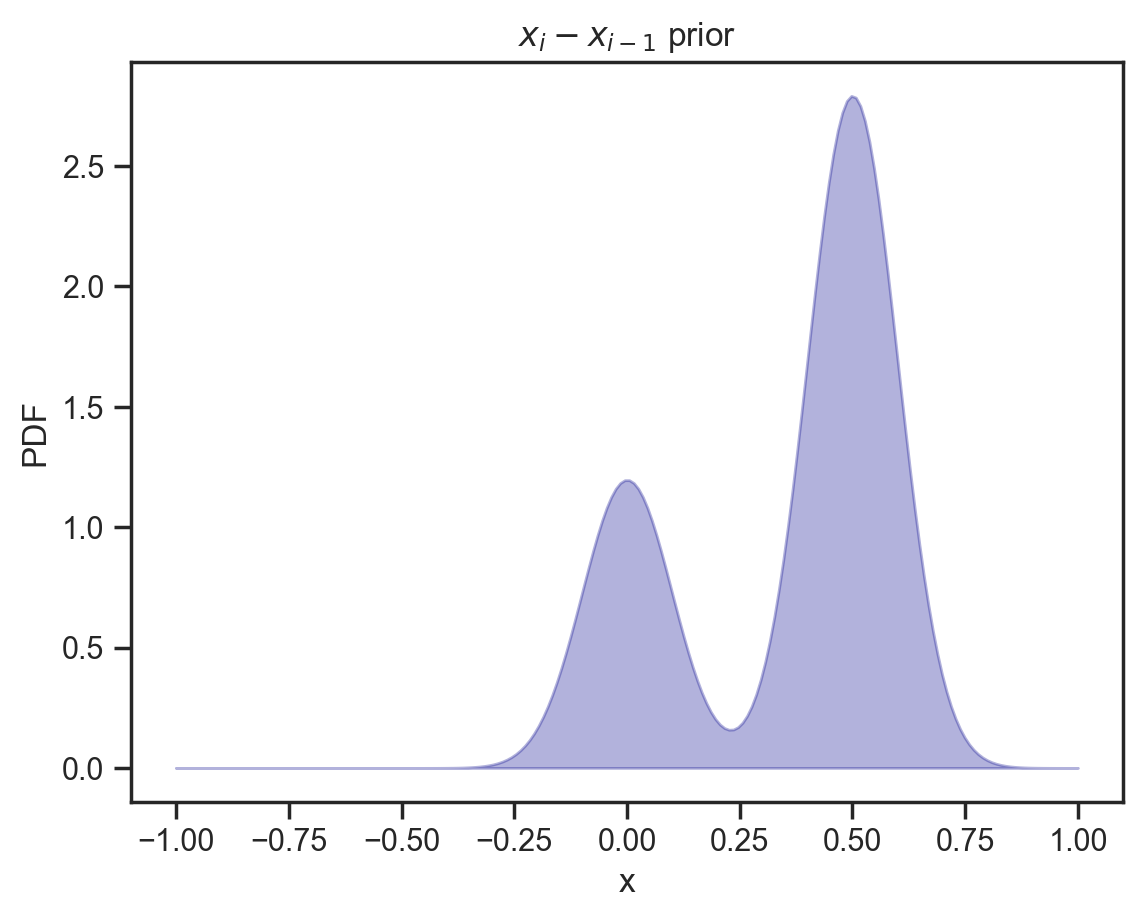
def model7(obs_vals, obs_idx):
    x = sample('x', d.expand([100]))
    sample('x_dependence', d_dep, obs=x[1:] - x[:-1])

mcmc = MCMC(NUTS(model7), num_warmup=1000, num_samples=200)
mcmc.run(jax.random.PRNGKey(0), obs_vals, obs_idx)
samples = mcmc.get_samples()

plt.scatter(x_points.flatten(), samples['x'].flatten(), color='darkblue', alpha=0.01, s=10)
plt.plot(x_points[0], samples['x'].mean(axis=0), color='crimson', lw=2, label='Mean')
plt.legend();
sample: 100%|██████████| 1200/1200 [00:03<00:00, 396.09it/s, 127 steps of size 6.49e-02. acc. prob=0.84]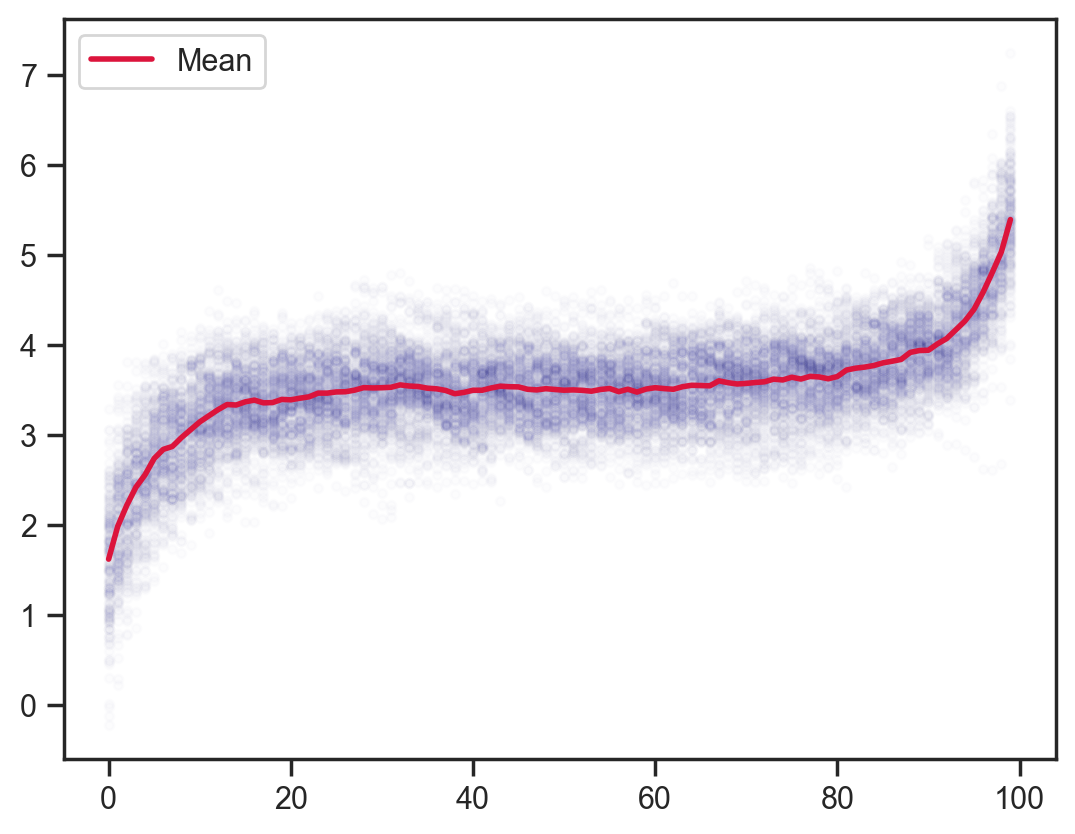
With the observations added back in you can see how the function finds it easier to catch up with sudden rises than falls due to the prior on adjacent values.
def model8(obs_vals, obs_idx):
    x = sample('x', d.expand([100]))
    sample('x_dependence', d_dep, obs=x[1:] - x[:-1])
    sample('x_point_obs', dist.Normal(loc=obs_vals, scale=0.25), obs=x[obs_idx])

mcmc = MCMC(NUTS(model8), num_warmup=1000, num_samples=200)
mcmc.run(jax.random.PRNGKey(0), obs_vals, obs_idx)
samples = mcmc.get_samples()

plt.scatter(x_points.flatten(), samples['x'].flatten(), color='darkblue', alpha=0.01, s=10)
plt.plot(x_points[0], samples['x'].mean(axis=0), color='crimson', lw=2, label='Mean')
plt.scatter(obs_idx, obs_vals, label='Observed values', color='crimson', s=20)
plt.legend();
sample: 100%|██████████| 1200/1200 [00:02<00:00, 497.90it/s, 255 steps of size 5.76e-02. acc. prob=0.88]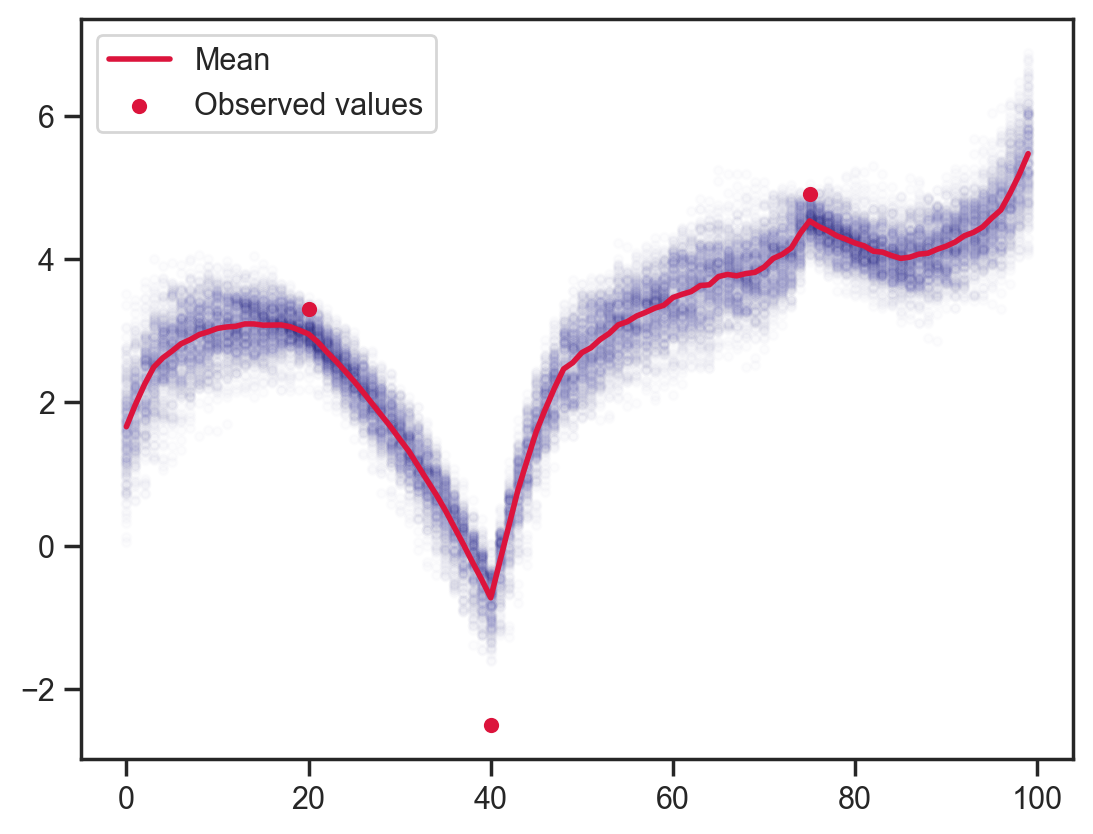
Very cool and I think quite useful for modelling chromatograms.